

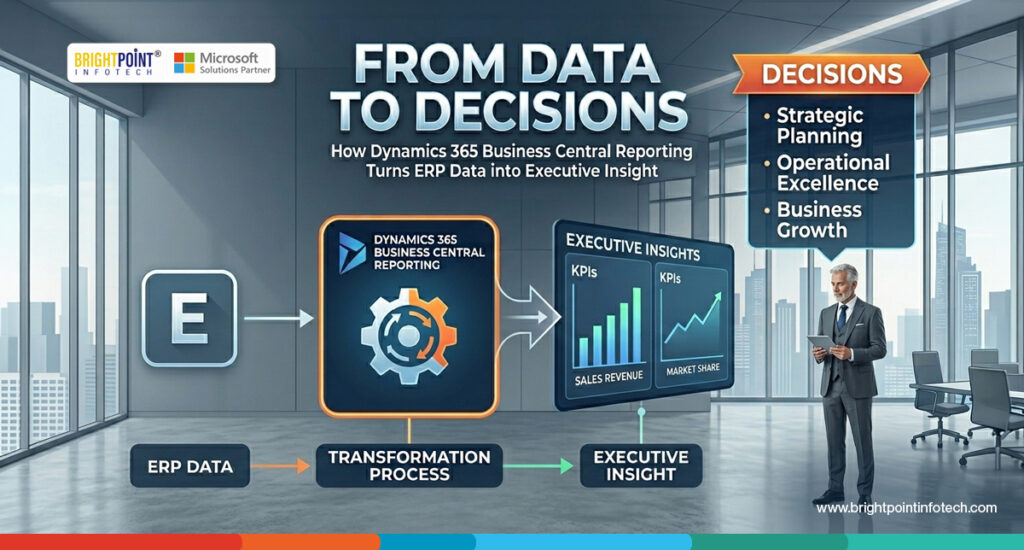
From Data to Decisions: How Dynamics 365 Business Central Reporting Turns ERP Data into Executive Insight
The New Mandate for ERP: Insight, Not Just Transactions
For many growing organizations, ERP systems have traditionally been viewed as systems of record. They capture invoices, purchase orders, inventory movements, payments, journal entries, customer activity, and financial transactions. But in today’s operating environment, recording data is no longer enough.
Executives need to know what the data means.
They need answers to questions such as: Which customers are driving margin? Where is working capital tied up? Which inventory items are moving slowly? Which departments are exceeding budget? Which operational trends require immediate action?
This is where Microsoft Dynamics 365 Business Central reporting becomes more than a back-office capability. It becomes a decision intelligence layer for finance, operations, sales, procurement, and executive leadership.
Microsoft positions Business Central with multiple business intelligence capabilities, including financial reports, KPIs, dashboards, ad-hoc analysis, and standard reports that help organizations transform business data into actionable insight.
Why Traditional ERP Reporting Falls Short
Many businesses still depend on manual Excel exports, disconnected reports, and periodic finance-driven analysis. While these methods may work in early stages, they quickly become a bottleneck as the business scales.
The common symptoms are familiar:
Leadership meetings rely on outdated spreadsheets. Finance teams spend hours reconciling numbers before analysis can begin. Department heads create their own versions of the truth. Operational decisions are delayed because data is spread across finance, sales, inventory, purchasing, and service workflows.
The result is not a lack of data. It is a lack of trusted, timely, and contextual insight.
Dynamics 365 Business Central addresses this gap by bringing reporting closer to the daily business process. Users can access standard reports, analyze list data, use Excel-based reporting, and connect Business Central data to Power BI for more advanced dashboards and visual storytelling.
Business Central Reporting: From Operational Visibility to Executive Intelligence
The strength of Business Central reporting lies in its ability to support different levels of decision-making.
At the operational level, teams can review transactions, aging, inventory, purchasing, sales orders, vendor balances, and cash flow indicators. At the management level, users can track performance by department, location, dimension, customer, item, project, or cost center. At the executive level, Power BI dashboards and financial analytics can convert ERP data into boardroom-ready insight.
This creates a more mature reporting model:
- Operational reporting answers what happened.
- Management reporting explains where performance is changing.
- Executive analytics helps leaders decide what to do next.
For CFOs, this means better control over cash, budgets, receivables, payables, and profitability. For COOs, it means improved visibility into inventory, procurement, fulfillment, and operational efficiency. For sales leaders, it means faster insight into customer trends, revenue pipelines, and order performance.
Power BI and Business Central: Turning ERP Data into Dashboards
One of the most important reporting advantages of Business Central is its integration with Microsoft Power BI. Power BI can retrieve Business Central data, help users build dashboards and reports, support drill-down analysis, and combine data from multiple Business Central companies where required.
This is especially valuable for executives because Power BI helps shift reporting from static tables to interactive dashboards.
Instead of reviewing multiple reports separately, leadership teams can monitor KPIs such as:
- Revenue by customer, region, item, or business unit
- Gross margin trends
- Accounts receivable aging
- Cash flow movement
- Inventory turnover
- Purchase order commitments
- Budget versus actuals
- Top customers and products
- Sales order backlog
- Vendor performance
Business Central also supports embedded Power BI experiences, allowing users to view Power BI reports inside the Business Central client. Microsoft notes that Business Central includes a Power BI FactBox on several list pages, where reports can update and filter based on the selected record.
For business users, this reduces the friction between transaction processing and analysis. For executives, it creates a clearer path from ERP activity to business performance.
Excel Layouts: Familiar Reporting with Stronger ERP Governance
Excel remains one of the most widely used tools for business analysis. Business Central recognizes this reality by supporting Excel report layouts based on .xlsx workbooks. These layouts can include formulas, PivotTables, PivotCharts, and other familiar Excel capabilities for summarizing and presenting data.
This is important because not every reporting requirement needs a full dashboard. Finance teams often require structured financial packs, board reports, statutory schedules, variance reports, and management reporting formats that Excel can support effectively.
The advantage is that Business Central keeps the reporting connected to governed ERP data while still allowing users to work in a familiar format.
In practical terms, this gives finance teams the flexibility of Excel without fully disconnecting from the ERP foundation.
Analysis Mode: Faster Ad-Hoc Insights Inside Business Central
Business leaders often need quick answers without waiting for a custom report. Business Central’s analysis mode supports this need by allowing users to analyze list page and query data directly within Business Central.
Microsoft describes analysis mode as an interactive way to calculate, summarize, and examine data using actions such as grouping, filtering, pivoting, and arranging fields into rows and columns.
This is valuable for day-to-day decision-making. A finance manager can quickly analyze customer ledger entries. A purchasing manager can review vendor activity. An inventory manager can filter slow-moving items. A controller can analyze changes in financial reporting definitions or audit logs.
The broader implication is significant: reporting becomes less dependent on IT and more available to business users at the point of decision.
AI-Assisted Analysis: The Emerging Future of ERP Reporting
As ERP reporting evolves, AI-assisted analysis is becoming a major area of innovation. Business Central includes Copilot capabilities, including analysis assist for analysis mode. Microsoft states that analysis assist can help users create analysis tabs by using natural language instructions, converting requests into structured views with aggregations, summaries, filters, and pivots.
However, it is important to position this realistically. Microsoft’s FAQ clarifies that analysis assist helps organize and present data; it does not independently provide final business conclusions. The user still needs to interpret the data and make decisions.
For organizations, this means AI can reduce the effort required to prepare analysis, but leadership judgment, process knowledge, and governance remain essential.
The future of ERP reporting is not just automated dashboards. It is a more intuitive experience where users can ask better questions, explore data faster, and act with greater confidence.
What Executives Should Expect from a Modern Business Central Reporting Strategy
A strong Business Central reporting strategy should not begin with dashboards. It should begin with decision priorities.
Executives should first define which decisions matter most. For example:
- How do we monitor cash risk weekly?
- Which KPIs define profitable growth?
Where do we need faster visibility into inventory or procurement? - Which dimensions should be mandatory for management reporting?
- What does the leadership team need every month to make better decisions?
Once these priorities are clear, the reporting architecture can be designed across Business Central, Excel, Power BI, and AI-assisted analysis.
A mature reporting approach should include:
- Clean chart of accounts and dimensions
- Role-based reporting for finance, sales, purchasing, inventory, and leadership
- Standard reports for operational control
- Excel layouts for finance and board reporting
- Power BI dashboards for executive visibility
- Security and permissions for sensitive data
- Governance over report ownership and KPI definitions
- Training so users can self-serve analysis responsibly
The goal is not to create more reports. The goal is to create fewer, better, and more trusted insights.
Brightpoint Infotech’s Perspective: Reporting as a Business Transformation Layer
At Brightpoint Infotech, we see reporting not as a post-implementation activity, but as a core part of ERP transformation.
When organizations implement or optimize Microsoft Dynamics 365 Business Central, they should not only ask, “Can the system process our transactions?” They should also ask, “Can leadership make faster, better decisions from this system?”
That shift changes the implementation conversation.
It requires strong ERP design, clean master data, meaningful dimensions, well-structured financial reporting, integrated Power BI dashboards, and executive alignment around KPIs.
For growing organizations, this is where Business Central can deliver measurable value: not only by improving operational efficiency, but by creating a trusted source of business insight.
Conclusion: Data Becomes Valuable When It Drives Decisions
ERP data has no strategic value if it remains hidden in tables, exports, and disconnected reports. Its value emerges when it helps leaders act.
Dynamics 365 Business Central reporting helps organizations move from historical reporting to active decision support. With built-in reports, financial analytics, Excel layouts, analysis mode, Power BI integration, and emerging Copilot capabilities, Business Central provides a practical foundation for turning day-to-day ERP activity into executive insight.
For business leaders, the opportunity is clear: modernize reporting, strengthen visibility, improve accountability, and make decisions with greater speed and confidence.
Brightpoint Infotech helps organizations design, implement, and optimize Microsoft Dynamics 365 Business Central reporting strategies that convert ERP data into actionable business intelligence.
Explore Brightpoint Infotech Solutions
Explore Our Recent Blogs & Resources
Whether you are a start-up, an SMB, or an enterprise, the Brightpoint Infotech blog is the best place to get inspired and learn more about Microsoft Business Applications.